Synthesis and popularization
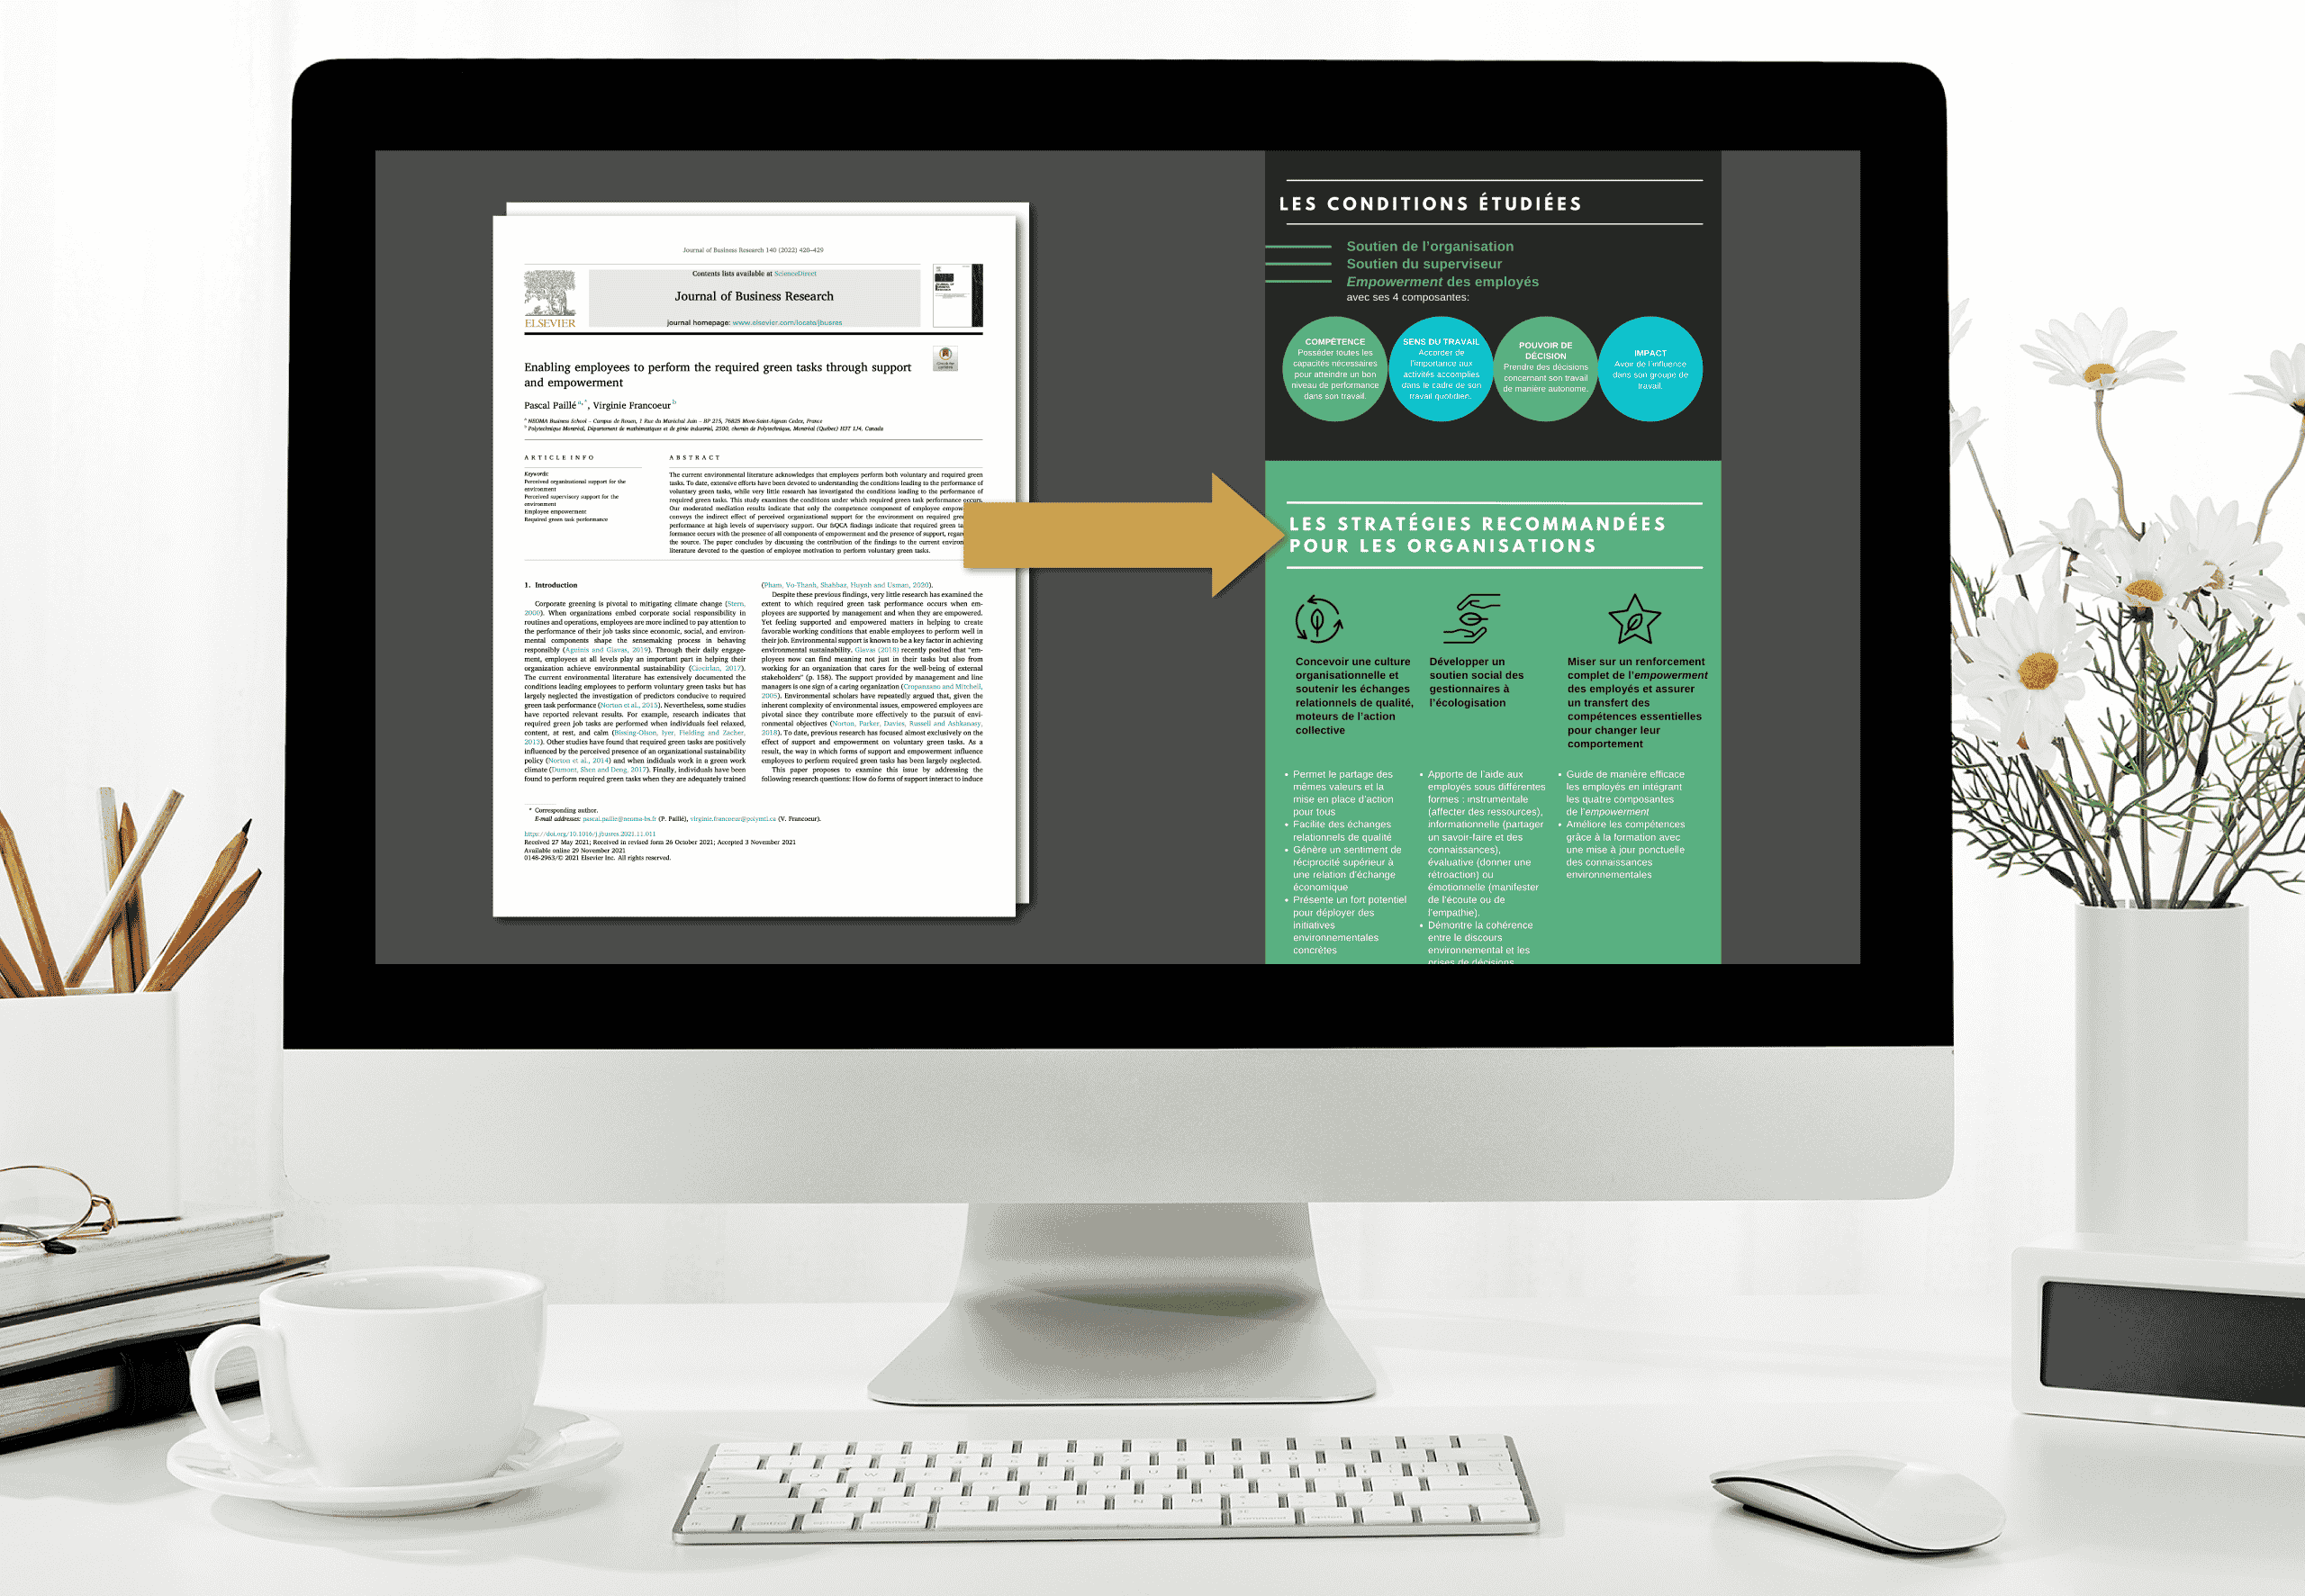
The synthesis of the scientific article makes it possible to extract the information that is relevant to the audience targeted by the infographic: contextual elements, methods, research results and intervention strategy. The chosen method: meeting with the researcher to ensure that we understood the need (target audience, objectives and key messages), reading the article, writing a summary, validation of key messages by the researcher.
Since the subject of the article was rather niche and focused on methodology, highlighting the most relevant messages for the target audience and popularizing them was important, to allow the researcher to use the final product for the pursuit of her projects (supporting companies in the implementation of ecoresponsible practices). Therefore, the synthesis, popularization and validation of key messages was the most important phase. External proofreading also helped to ensure that the language used was accurately conveyed.
Graphic design (OR visual identity) and infographics
The next step was to choose the graphic elements such as colors and to discuss with our graphic designer Sophie who shaped the infographic based on the information.
The objective of the infographic is to disseminate the results of a research project in an attractive visual format, so that the target audience can feel engaged and quickly find the answers to their questions. The chosen method: meeting with our graphic designer, formatting of the synthesis and definition of the main sections of the infographic, selection of images and logos, validation and adjustment.
Promotion
The last step was the promotion of the infographic on our blog and on social media (Linkedin and Facebook). The chosen method: making three posts, publishing in stages (1 post every two days), identifying and sharing publications with key people, networks and institutions.